Saturday, October 24, 2009

The UNESCO World Report on Cultural Diversity makes reference to P3DM done by Ogiek Peoples

The 420-page UNESCO World Report on Cultural Diversity has been launched by the Director-General, to the attention of the Permanent Delegates to the 35th session of the General Conference, on Tuesday 20 October 2009.

The use of participatory three-dimensional modelling (P3DM) by the Ogiek Peoples in Kenya is cited in section 2.4 as an example of local Empowerment (see page 52 of the report).

Specifically the report makes reference to the article published by Rambaldi et al. on Information Development in 2007: Through the eyes of hunters-gatherers: Participatory 3D modelling among the Ogiek indigenous peoples in Kenya.

It is worth noting that the power of participatory mapping coupled with Web 2.0 commnunication tools (ppgis list, blog, YouTube, etc) coupled with actions undertaken by concerned stakeholders, have raised the concerns faced by a minority group like the Ogiek at the forefront of public opinion.

Friday, October 23, 2009

Dr. Robert Chambers elaborates on Participatory GIS (PGIS) practice


Dr. Robert Chambers from the Institute of Development Studies (IDS), UK, reflects on the intersection of participatory development and Geographic Information Systems (GIS) and on the resulting good and bad practices. In the interview Dr. Chambers calls on practitioners and development agencies to ensure that good practice is put in place to avoid the repetition of the misuse of PRA (i.e. Participatory Rural Appraisal) done in the 80's and 90's.

Thursday, October 22, 2009

The future of environmental law mapping

Laurent Granier from ecocy recently wrote an essay on the future of environmental law mapping where he argues GIS and mapping tools are transforming our vision of legal data, “from vertical books to horizontal maps”. Drawing on examples of online mapping tools and representations, including participatory GIS, he shows a tendency for law and policy makers to aggregate administrative and legal layers in maps, towards more and more legally binding tools.

Sunday, October 18, 2009

Pister la Vie Sauvage dans l'Age de la Cybernétique


Le CTA a fait paraître dernièrement une vidéo éducative sur la technologie CyberTracker. La vidéo est un élément d’un paquet pédagogique, destiné à promouvoir les bonnes pratiques en matière de production, de gestion, d’analyse et de communication de l’information géospatiale. D’une durée de 8 minutes, la vidéo est disponible en anglais, français, espagnol et met l’accent sur de nombreux domaines dans lesquels cette technologie peut être utilisée à des fins de développement et de conservation de l’environnement.

CyberTracker est un logiciel en libre accès (open source) mis au point en Afrique du Sud par l’ONG CyberTracker Conservation avec, à l’origine, le soutien financier de la Commission Européenne. Il peut être installé sur tout appareil portable équipé d’un GPS – un Assistant numérique personnel (PDA) ou un Smartphone, par exemple – et permet de recueillir des données géoréférencées avec des annotations numériques détaillées. C’est un moyen extrêmement efficace de stocker de grandes quantités d’observations géocodées faites sur le terrain, à une vitesse et avec un niveau de précision et de détail inédits. CyberTracker permet aux utilisateurs de personnaliser l’interface pour mieux l’adapter à leurs besoins de collecte de données. Les écrans sont configurés de manière à pouvoir combiner du texte et des icônes, pour garantir ainsi une efficacité et une personnalisation optimales. L’interface icônes de l’application CyberTracker a été initialement conçue pour les pisteurs qui ne pouvaient ni lire ni écrire. Aujourd’hui, tous les utilisateurs – y compris scientifiques et écologistes – mettent à profit cette interface icônes parce qu’elle permet de saisir les données beaucoup plus rapidement.

Saturday, October 17, 2009

Educational Video ob CyberTracker - Tracking in the Cyber Age

The CTA recently released an educational video on CyberTracker technology. The video has been produced in the context of the development of a training kit aimed at supporting the spread of good practice in generating, managing, analysing and communicating spatial information. This 8-min video on CyberTracker covers a number of uses to which geospatial information technology (GIT) can be put to work in the contexts of development and conservation.

CyberTracker is an open-source software developed in South Africa by the Cybertracker Conservation with financial support initially provided of by the European Commission. It can be installed on a GPS-enabled handheld device such as a Personal Digital Assistant (PDA) or a Smartphone to collect geo-referenced data with detailed digital notation. It is a highly efficient way to gather large quantities of geo-coded field observations at a speed and level of detail not possible before. CyberTracker allows users to customise the interface to meet data collection needs. Screen designs can combine text and icons to optimise efficiency and customisation. The CyberTracker icon interface was originally designed for trackers who could not read or write. Nowadays all users including scientists and conservationists benefit from the icon-based interface because it enables significantly faster data entry.

Saturday, October 10, 2009

Participatory 3D Modelling: a Review ...

Giacomo Rambaldi makes a summary of his involvement in the improvement, development, promotion and dissemination of a participatory mapping method better known asl Participatory 3D Modelling (P3DM).


Participatory 3D Modelling (P3DM) is a community-based mapping method which integrates local spatial knowledge with data on elevation of the land and depth of the sea to produce stand-alone, scaled and geo-referenced relief models. Essentially based on local spatial knowledge, land use and cover, and other features are depicted by informants on the model by the use of pushpins (points), yarns (lines) and paints (polygons). On completion, a scaled and geo-referenced grid is applied to facilitate data extraction or importation. Data depicted on the model are extracted, digitised and plotted. On completion of the exercise the model remains with the community. More information on the method are available at iapad.org

Sunday, October 04, 2009

Une modélisation participative en 3D du paysage montagneux historique de Wechecha (Éthiopie)

MELCA Mahiber, ONG éthiopienne membre du réseau African Biodiversity Network (ABN), a contribué à la construction d'une carte participative en 3D (CP3D) du paysage montagneux historique de Wechecha, dans la région d'Oromia, à côté des woredas de Walmara et Sebeta Awas, en Éthiopie.

Une fois achevée, la maquette a été inaugurée par un représentant du Président de la République fédérale démocratique d'Éthiopie. Cette cérémonie a réuni plus de 500 personnes, parmi lesquelles des membres du Conseil des représentants des peuples, des membres du gouvernement et des représentants d'organisations internationales, d'organisations de la société civile et de collectivités locales.

Construite à l'échelle 1:10 000, la maquette reproduit une zone de 24 km sur 28 km. Plus de 40 élèves et membres d'associations de jeunes ont participé à la construction de la maquette initiale, que les habitants de la région, notamment les anciens, ont été invités à enrichir de leurs connaissances géographiques. Au cours du processus, des informations sur le massif ont été échangées entre les différentes générations, mais aussi avec les collectivités locales et d'autres parties prenantes, ouvrant la porte à des débats de fond sur la gestion et la protection durables de la culture et de l'environnement à l'échelle locale. Les gouverneurs de la région se sont montrés extrêmement favorables à ce projet, jouant un rôle actif au sein du processus, aux côté des organisateurs.

Ce projet avait pour ambition de collecter des données sur le savoir écologique traditionnel des communautés de la région pour le valoriser. Ainsi, les autorités externes lui accorderont davantage d'importance lors de la gestion collaborative des ressources naturelles. L'objectif secondaire du projet consistait à améliorer la transmission de ce savoir aux nouvelles générations.

Maintenant que la maquette est achevée, elle servira d'environnement de référence où habitants, membres du gouvernement et différentes parties prenantes pourront débattre de programmes de gestion et de réhabilitation.

Kalkidan, 15 ans, est une élève de l'école d'Holeta. Elle est consciente que sa génération a appris énormément des anciens de la région grâce à cette maquette. Elle s'est exprimée ainsi lors de l'inauguration : « Nous, les jeunes, ne pensions pas que les anciens en savaient autant. Mais après avoir participé à la construction de cette maquette participative en 3D, nous sommes désormais convaincus que nos anciens sont une mine d'informations sur l'environnement ». Elle a rappelé qu'au cours de ce projet, ce sont les anciens qui ont tenu le premier rôle.

Lors de la cérémonie, des anciens ont montré l'emplacement de leur village d'origine sur la maquette, avec des anecdotes. Ils n'ont pas pu cacher leur désarroi envers la dégradation de la région, et ont demandé aux organismes concernés de tenter de résoudre ce problème. Les membres du gouvernement ont également approuvé la maquette et rappelé qu'elle ne se résumait pas à un simple objet de décoration.

Le Dr Tewoldebithan G/Egziabher, directeur de l'autorité fédérale de protection de l'environnement et président de l'assemblée générale de MELCA, a remis la maquette à la ville d'Holeta et à l'administration du woreda de Walmara au nom de son association. Il a demandé à l'administration d'utiliser la maquette comme référence topographique.

Million Belay, directeur du MELCA, a annoncé de nouvelles initiatives. Un processus de planification à grande échelle sera lancé pour réhabiliter le paysage montagneux de Wechecha, en s'appuyant principalement sur la maquette. Les écoles situées au pied des montagnes intégreront la maquette à leur programme, à l'instar de la région de Nessuit (Kenya), qui possède une maquette comparable depuis 2006. Les enseignants l'utiliseront pour aider les élèves à connaître leur environnement, la géographie et les paysages culturels. Par ailleurs, Million Belay a annoncé que la maquette en 3D servirait à des fins scientifiques, pour étudier d'une part la relation entre habitants et environnement, et d'autre part les conséquences de la dégradation des terres sur les moyens de subsistance des communautés locales.

Auteur : Giacomo Rambaldi

Participatory 3D Model of the historical Wechecha mountain complex, Ethiopia

MELCA Mahiber, an Ethiopian NGO which is part of the African Biodiversity Network (ABN) facilitated the construction of a Participatory 3 Dimensional Model (P3DM) of the historical Wechecha mountain complex, which is found in Oromiya Regional State, adjacent to Wolmera and Sebeta Awas Woreda in Ethiopia.

Once completed the model has been inaugurated by a Representative of the President of Federal Democratic Republic of Ethiopia. Over 500 people participated in the ceremony including members of the House of People Representative Councils, governmental officials and representatives from international organizations, CSO and local communities.

The 1:10.000 scale model covers an area of 24 km by 28 km. Over 40 students and representatives from youth groups constructed the blank model. Residents of the area, especially elders, were invited to populate the map with their spatial knowledge. In the process information about the mountain area has been shared across generations and between local communities and other stakeholders, opening the door for deeper discussions on the sustainable management and safeguarding of both local culture and environment. The local Governors were very supportive. They played an active role in the process together with the organisers.

The objective of the exercise was to document the Traditional Ecological Knowledge (TEK) of resident communities, and add value and authority to it in order to increase the value external authorities would attach to it when it comes to collaborative natural resource management. A second objective of the exercise was to enhance the transfer of TEK the younger generations.

Now thet the model is completed it will as a reference environment where local people, government officials and other stakeholders can discuss management and rehabilitation plans.

Kalkidan is a 15-year old student at Holeta Primary School. She witnessed how this model created an opportunity for her and her friends to learn a lot from the local elders. At the inauguration she stated the following: “We youngsters didn’t think that elders know, but now, after participating in the construction of this Participatory 3 Dimensional Model, we are convinced that our elders have a deep knowledge about their environment” She recalled that the elders were the main actors on the scene.

At the ceremony Elders locaed their places of origin on the model and talked about them. They couldn’t hide their feeling that their area is becoming degraded and pleaded for concerned bodies to address this problem. The government representatives also endorsed the model and reiterated that it should not be just for looking at and admiring.”

Dr. Tewoldebithan G/Egziabher, Director of the Federal Environmental Protection Authority and Chairman of MELCA’s General Assembly delivered the model to Holeta Town and Wolmera Woreda Administrations on behalf of MELCA. He told to the Administrations to use the model as a reference for taking measures.

According to Million Belay the Director of MELCA related initiatives will follow: There will be an intensive planning process aiming at rehabilitating the Wechecha Mountain complex and we will ensure that the model will be central to it. Schools located at the foothills of the mountain will make use of the model in their curriculum like it is currently happening in Nessuit Kenya, where a similar model has been constructed in 2006. Teachers use it to facilitate pupils learning about their environment, geography and cultural landscapes. In addition, Mr. Belay stated that the 3D model will be used for scientific research, on the relationship between people and the environment, and to study the impacts of land degradation on the livelihood of local communities.

Thursday, October 01, 2009

Ogiek Appeal to the Kenya Government Notice to vacate Mau Forest Complex and other water towers

Joseph K. Sang, representative from the Ogiek community in Nessuit Kenya, launches an appeal to the Government of Kenya following an eviction notice published on all mayor newspapers on August 25, 2009 and concerning the vacation of the Mau Forest Complex by all illegal occupants.

Francis Kakwetin Lesingo reports on the use of a 1:10,000 scale 3D model in Nessuit Kenya

Mr. Francis Kakwetin Lesingo - a representative from the Ogieks living in the Mau complex (Nakuru,Kenya) - reports back on the use of a 1:10,000 scale georeferenced physical 3d model manufactured by 26 ogiek clans in 2006 and 2007 in Nessuit Kenya. The initiative has benefitted from technical and financial assistance provided by CTA, Ermis Africa, the Indigenous Peoples of Africa Coordinating Committee (IPACC) and the Gaia Foundation UK.

Wednesday, September 30, 2009

The Touch Table for participatory land use planning

This video shows how the Touch Table can be used to support land use planning with multiple stakeholders with multiple interests

Friday, September 18, 2009

Web-Based GIS and the Future of Participatory GIS Applications within Local and Indigenous Communities

As resource managers search for strategies to meet the challenges posed by intense competition for scarce local resources, the implementation of Community-based GIS applications have become widespread. Besides mapping, the Participatory GIS (PGIS) projects create a peaceful medium for community groups and public officials to meet, exchange views and also learn to develop trust for each other. However, PGIS projects face many problems including the lack of basic supporting infrastructure and services. The adoption of the Internet as a platform for PGIS applications therefore raises concerns about the future of PGIS projects. While the Internet may open the participatory process, it can also hinder participation among local groups. In an era when PGIS applications have become important in the management of local resources, there is an urgent need to examine implications of the On-line PGIS project. Accordingly, in their paper, by the title Web-Based GIS and the Future of Participatory GIS Applications within Local and Indigenous Communities, Peter Kyem and James Saku assess the potential benefits and drawbacks of on-line PGIS applications within local communities.

Applications of GIS in Community Forestry: Linking Geographic Information Technology to Community Participation

Planning and managing forest resources in todays ever-changing world is becoming very complex and demanding challenges to forest resource managers. Because of the multiple interests of forest users and other community interest groups, a wider range of up-to-date information is being requested in community forestry, than has been used in conventional government-based forest management in the past. Geographic Information Systems (GIS) and related technologies provide foresters and resource planners with powerful tools for planning, management and decision making. Recent trend towards community based forest management has added new dimensions and potential to use of GIS in community forestry. This book explores the potential and constraints for the application of GIS technology in community based forestry. This book will be of interest to forest managers, community development practitioners, researchers and students interested in using GIS technology in forestry and participatory GIS.

Wednesday, September 16, 2009

How to create a "My Map" in Google Maps


How to create personalized, annotated, customized maps using Google Maps.

Here is an example: P3DM Where?

Head teacher Julius Sangogo reports on the usefullness of a Participatory 3D Model (P3DM) in Nessuit, Kenya

Head teacher Julius Sangogo reports on the usefullness of a Participatory 3D Model in Nessuit, Kenya from CTA on Vimeo.

Three years after the completion of a Participatory 3D model in Nessuit Kenya, head teacher Julius Sangogo recalls the uses of the model by local, national and international agencies and more importantly by the pupils of the local primary school.

The Mystery of Capital among the Indigenous Peoples of the Amazon

Part 1 The Mystery of Capital among the Indigenous Peoples of the Amazon from ILD on Vimeo.

A film directed by James Becket
Conceived of and written by Hernando de Soto
Produced by Bernardo Roca Rey and Hernando de Soto
Research Director Ana Lucía Camaiora
A Becket Films LLC and Institute for Liberty and Democracy Production


Part 2 The Mystery of Capital among the Indigenous Peoples of the Amazon from ILD on Vimeo.

A film directed by James Becket Conceived of and written by Hernando de Soto Produced by Bernardo Roca Rey and Hernando de Soto Research Director Ana Lucía Camaiora A Becket Films LLC and Institute for Liberty and Democracy Production


Part 3 The Mystery of Capital among the Indigenous Peoples of the Amazon from ILD on Vimeo.

A film directed by James Becket Conceived of and written by Hernando de Soto Produced by Bernardo Roca Rey and Hernando de Soto Research Director Ana Lucía Camaiora A Becket Films LLC and Institute for Liberty and Democracy Production

Wednesday, September 09, 2009

Participatory 3D Model (P3DM) of Chivoko village, Solomon Islands

A total of 60 representatives from the Chivoko community including youth, elders, women and men, students and chiefs; representatives from "Sasamunga Live and Learn", The Nature Conservancy (TNC), the "Lauru Land Conference of Tribal Communities" (LLCTC), and the Choiseul Provincial Fisheries constructed a 1:20,000 scale Participatory 3D Model (P3DM) of Chivoko village in the Tavula ward, Choiseul Province, Solomon Islands. The model covering a total area of 192 sq km is the 1st if its kind in Solomon Islands.

The model has been done to serve a key negotiation tool for the Chivoko community to map out the watershed and coastal areas it depends on to address the challenges facing sustainable resource management and conservation. The initiative aims at securing the conservation of the Chivoko Watershed forests (approx 8000 ha) and place them legally beyond the reach of industrial logging ventures. The project will draw on national expertise to produce a collaborative watershed management plan which will provide guidance for sustainable forest development practices by a community cooperative.

More information is found here.

Tuesday, September 01, 2009

Qualitative GIS: A Mixed Methods Approach

'Qualitative GIS is coming of age, and this definitive collection explains why it deserves broad attention. These carefully selected essays by leading researchers, organized around a broad conception of qualitative GIS that extends beyond multi-media data integration to embrace new software tools and interpretive, situated epistemologies, will push readers to rethink not only their preconceptions about qualitative GIS, but also about GI science and critical GIS. GIS researchers, practitioners, observers and users will find much to chew on here' - Professor Eric Sheppard, University of Minnesota, USA

Geographic Information Systems are an essential tool for analyzing and representing quantitative spatial data. Qualitative GIS explains the recent integration of qualitative research with Geographical Information Systems

With a detailed contextualising introduction, the text is organised in three sections:

Representation: examines how researchers are using GIS to create new types of representations; working with spatial data, maps, and othervisualizations to incorporate multiple meanings and to provide texture and context. This section includes a chapter by Jon Corbett and Giacomo Rambaldi dealing with participatory mapping by the title: "Geographic information technologies, local knowledge, and change (pages 75-91).

Analysis: discusses the new techniques of analysis that are emerging at the margins between qualitative research and GIS, this in the wider context of a critical review of mixed-methods in geographical research

Theory: questions how knowledge is produced, showing how ideas of 'science' and 'truth' inform research, and demonstrates how qualitative GIS can be used to interrogate discussions of power, community, and social action

Making reference to representation, analysis, and theory throughout, the text shows how to frame questions, collect data, analyze results, and represent findings in a truly integrated way. An important addition to the mixed methods literature, Qualitative GIS will be the standard reference for upper-level students and researchers using qualitative methods and Geographic Information Systems.

Available from Amazon.com (US) and Amazon.co.uk (Europe)


Tuesday, July 21, 2009

Discrete Community Mapping in Sudan

On Wednesday July 22, the Abyei Arbitration Council will announce its “Award”at the Permanent Court of Arbitration in the Hague. Latest act in a train of events since the signing of the Comprehensive Peace Agreement (CPA) of 2005 by Southern and Northern Sudan.

In 2005, the CPA also created the Abyei Arbitration Tribunal (AAT) which issued a Final and Binding Ruling on the north-south border – which could become an international border following a referendum on Southern Sudan independence slated for 2011.

Kharthoum rejected this Ruling, causing a stalemate until May 2008 when the town of Abyei, ancestral centre for the Ngok Dinka, was methodically sacked by a combination of Misseriya militias and troops from Khartoum - displacing 60,000 residents as collateral.

The border delineated by the AAT had been based on exhaustive interviews with elders from the nine Ngok Dinka chiefdoms, coupled with equally exhaustive historical map research. But, none of the sites mentioned by the elders, as evidence of ancestral occupancy, had been geocoded with GPS. The purpose of this mapping project was to rectify that with a repeat performance using GPS.

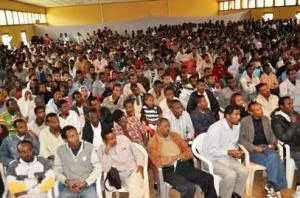
A legal team, from the US-based Public International Law & Policy Group (PILPG) and London-based WilmerHale, along with Southern Sudanese, colleagues re-interviewed the elders during a week long conference of all nine Ngok Dinka chiefdoms to plan the restoration of Abyei. During that same week, a team of 12 Ngok Dinka were trained in the use GPS units, videos and still cameras. At the same time, the lawyers’ interviews provided the information about the significant historical sites needed by the team to build up a legend. For litigational reasons beyond my understanding it was essential to demonstrate that, by 1905, Ngok Dinka had occupied an area well to the north of Abyei town.

Ngok Dinka memory stretched far further back than 1905. A principle signifier of historical occupancy were sites identified with Names for Age Sets, which were changed every ten years. The elders recited age set names and places going back centuries, the oldest stretched to 1508.
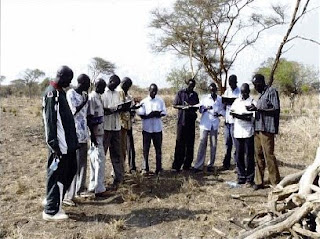
The mapping method was simple. Following the Abyei restoration conference, the team visited each chiefdom in turn and spent a day talking with 25 elders, going over recorded sites and seeking more. They then divided into three units and three vehicles, and selected elders guided them to the sites that had been listed. In two stints over the last winter, the mapping team, covered the disputed area and recorded almost 300 sites. Each evening the mapping log book were written up and emailed to International Mapping, Baltimore, US.

With the critical area covered, it was decided that, for the few days remaining the mapping teams, elders, and lawyers, would travel further north – to sites identified by the elders but outside the area that was critical for the Southern Sudan-Ngok Dinka case.

This brought the project to the attention of officials representing Northern Sudan. They were not too happy about it but all the required data was by then at the cartographers in Baltimore. The last few days were spent either under military escort, or waiting for an escort to materialize, or waiting for it to finish eating somewhere. Three trips were eventually made. To varying degrees they were high on inter-group tension but low on data utility so these data do not appear on the around Abyei. Shortly after, there were rumours of a Kharthoum-driven counter mapping effort, but it was too late.

With only a week of training and field exercises under their belts, the Ngok Dinka mapping team did outstanding work. During the recent Abyei Arbitration Tribunal hearing, lawyers for Kharthoum made a serious effort to dismiss their maps as “tainted data” but in the final exchange, they were outplayed by the legal team for Southern Sudan. For anyone seeking field workers in Southern Sudan, there are now several trained and contactable, but jobless, community information gathering and mapping people in circulation in the Abyei area. The

Verdict will be on this site on Wednesday. http://www.pca-cpa.org/ For a good, detailed account of the Abyei issue visit the Enough Project.

Read also: Dr. Peter Poole 2009. Ngok Dinka Abyei Area Community Mapping Project report, February 2009

Peter Poole, 21 July 2009

Saturday, June 20, 2009

Map symbols and coding means

Map symbols should be designed or chosen according to principles of logic and communication to serve as a graphic code for storing and retrieving data in a two or three dimensional geographic framework.

Appreciating the logic of map symbols begins with understanding the existence of three distinct categories, including point, line and polygons (areas).

Maps and 3D models include generally a combination of all three. These tree main categories can be further differentiated by variations in "hue" (color), "gray tone value", "texture" and "orientation", "shape" and "size".

Each of these variables or their combinations excel in portraying particular features and their variations.

When using color (hue) for characterizing areas, decoding is made simpler when darker means "more" and lighter means "less". Color conventions allow map symbols to exploit idealized associations of water with blue and forested areas with green. This the combination of the two, implies that dense primary forest is dark green, secondary forest green, and grassland light green, and that deep waters are dark blue and shallow waters light blue .

"Size" is more suited to for showing different in amount of count, whereas "variations in gray tone" are preferred for distinguishing differences in rate or intensity. Symbols varying in orientation are useful mostly for representing directional occurrences like winds, migration streams or other. Line symbols best portray water courses, roads, trails, boundaries and may combine different variables, including color and size (thickness). A heavier line readily suggests greater capacity or heavier traffic than a thin line implies.

Each symbol should be easily discernable from all others to clearly distinguish unlike features and provide a sense of graphic hierarchy. A poor match between the data and the visual variables may frustrate and confuse the map user.

While in planimetric mapmaking the only limitation in the choice of symbols is fantasy (with logic), participatory 3-D modeling (P3DM) frequently depends on the availability of materials, particularly for point features which are generally represented by push and map pins. Lines and polygons can be easily represented by color-coded yarns and different color paints.

Standardization of symbols serves for ready unambiguous recognition of features and promotes efficiency in both map production and use, exchange of data and comparison. Maps and models sharing a common graphic vocabulary are definitely more powerful in convening the intended message and decoding simpler.